
Recent Research
A full list of the EPPL’s publications can be found on Research Gate
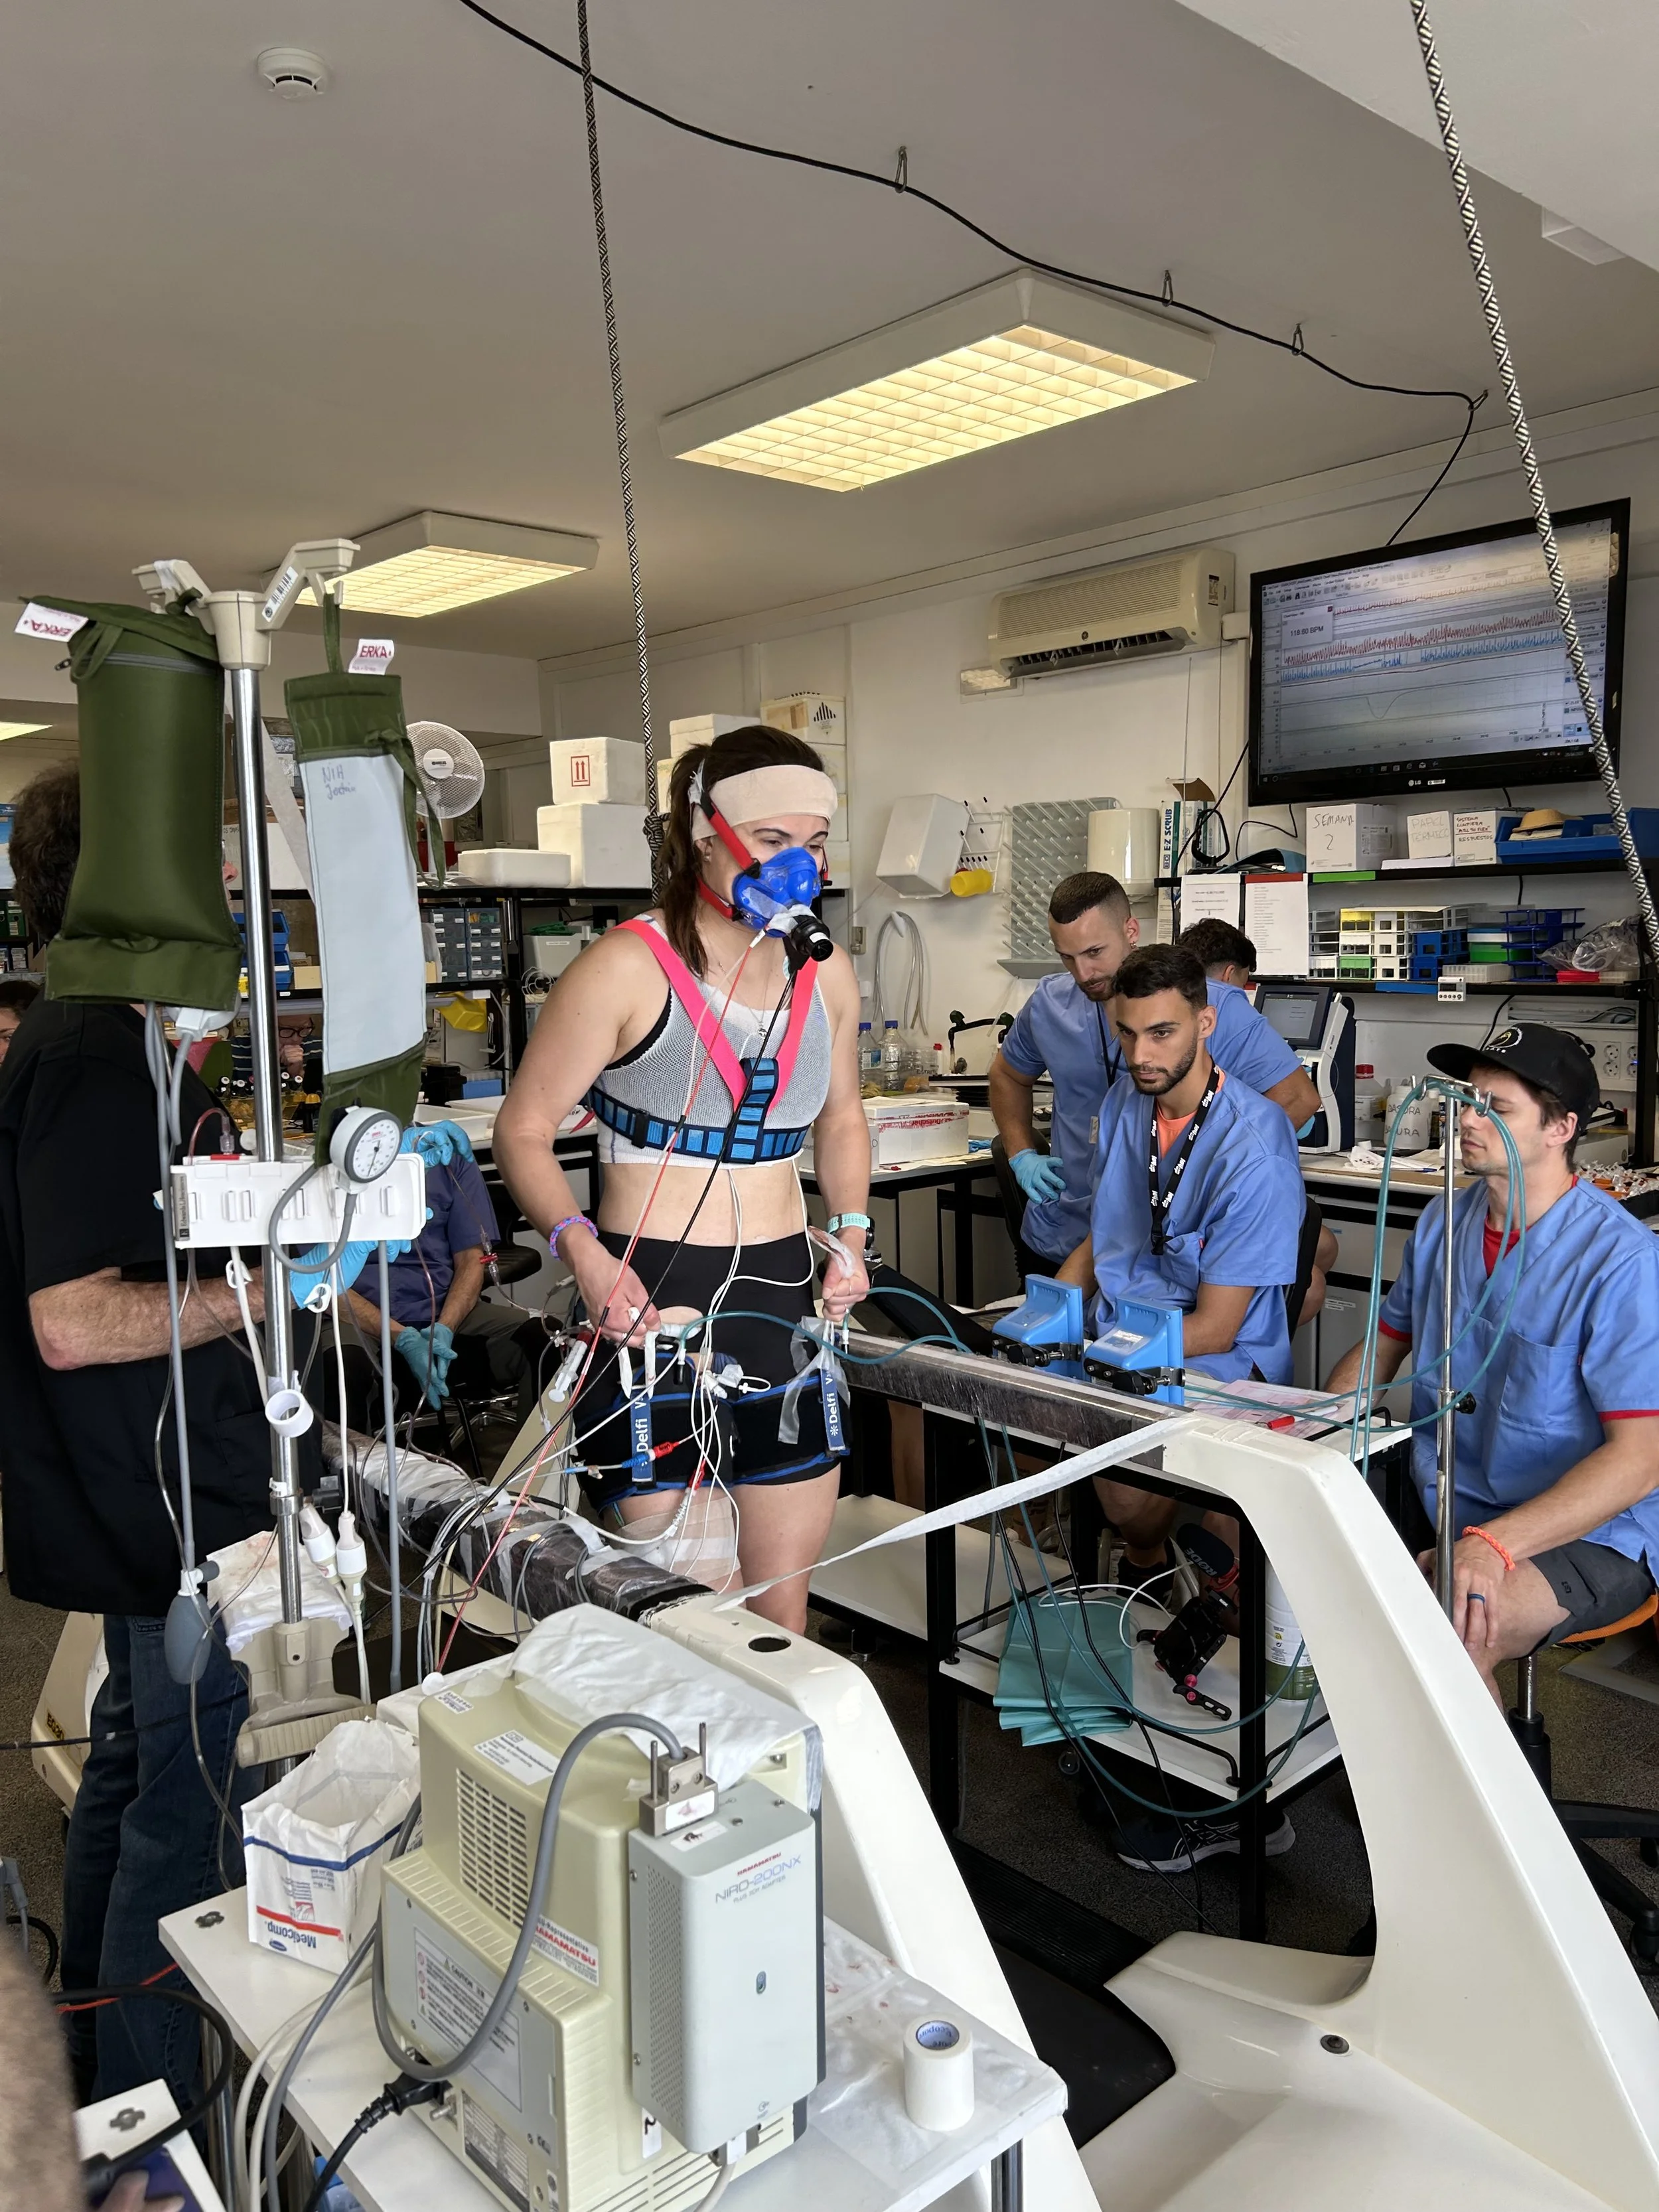
Testing in Las Palmas, Spain, for Kyle Thompson’s (UofG) “BEATS” study examining the mechanisms of aerobic exercise performance improvements with blood flow restriction training.
Highlighted Publications
Effects of intensified training with insufficient recovery on joint level and single muscle fibre mechanical function: The role of myofibrillar Ca2+ sensitivity
This second paper from the overtraining study examined changes in neuromuscular function following 3 weeks of high intensity overload training in endurance athletes. Neuromuscular function was assessed before and after overload training using both maximal knee extensions with electrically evoked twitch contractions and single fiber mechanical function assessed from muscle biopsy samples. It was found that maximal voluntary contraction of the knee extensors and maximal twitch-evoked contraction were not altered following overload training. However, there was a rightward shift in the force-frequency curve indicating that greater frequencies of stimulation were required to produce the same submaximal-intensity forces. The findings were similar in the single muscle fiber samples with no change to peak force production, but a rightward shift in the force:pCa2+ curve, indicating greater calcium concentrations were required to generate the same submaximal forces. Altogether this study suggests that high-intensity overtraining may not impair the neuromuscular ability to generate peak forces, but that submaximal forces require greater “effort”, and this is likely due to reduced myofibrillar calcium sensitivity. This was a great collaborative experience between the Burr, Power, & Cheng labs to enhance our understanding of overreaching-related fatigue.
Roussel, O.P., Pignanelli, C., Hubbard, E.F., Coates, A.M., Cheng, A., Burr, J.F., & Power, G.A. (2024). Effects of intensified training with insufficient recovery on joint level and single muscle fiber mechanical function: The role of myofibrillar Ca2+ sensitivity. APNM. Doi: https://cdnsciencepub.com/doi/10.1139/apnm-2024-0189

Figure 1. Experimental design of the overload training study.


Figure 2. (A) Joint level force-frequency before (gray) and after (black) 3-weeks of intensified training. (B) The frequency required to cause 20%, 50%, and 80% of the 100Hz force, and the ration of the 10:100Hz force.
Figure 3. Single muscle fiber level force-calcium curves expressed as absolute force output (A) or as relative percent to the highest force achieved in each experiment (B).
Altered carbohydrate oxidation during exercise in overreached endurance athletes is applicable to training monitoring with continuous glucose monitors
Coates, A. M., Thompson, K. M. A., Grigore, M. M., Baker, R. E., Pignanelli, C., Robertson, A. A., Frangos, S. M., Cheung, C. P., & Burr, J. F. (2023). Altered carbohydrate oxidation during exercise in overreached endurance athletes is applicable to training monitoring with continuous glucose monitors. Scan J Med Sci Sports. Doi: 10.1111/sms.14551
Following a 3-week high-intensity overload training block, we found that overreached endurance athletes demonstrated reductions in carbohydrate oxidation and circulating glucose during submaximal exercise, which was reversed following 5-7 days of recovery. There was no indication of overt low energy availability as a cause of the reduced carbohydrate oxidation and circulating glucose, although further work with experimentally controlled energy intake is required to ascertain this effect. Continuous glucose monitors used in combination with standardized glucose ingestion and warm-up exercise could provide another non-invasive assessment of overreaching status.

Figure 1. Experimental design of the 5-week overload training study in recreational endurance athletes. Weeks 1 (PRE) and 5 (REC) were prescribed at ~50% of regular training duration, with Weeks 2, 3, and 4 (OL) at ~150% of regular training duration. HRV, heart rate variability; OL, overload; PRE, pre-overload training; REC, recovery; RMR, resting metabolic rate.

Figure 2. Timeline of the exercise-test visits performed during the 5-week overload training study in recreational endurance athletes. Full experimental procedures occurred at Weeks 1 (PRE), 4 (OL), and 5 (REC), with paired-down visits (Hooper-Mackinnon well-being scale, cycling HR, and CGM glucose) occurring in Weeks 2 and 3 of the overload training block. Timeline not to scale. Checklist: HooperMackinnon well-being scale. Vacutainer 1: venous sample for epinephrine, hematocrit, and leptin. Drink: 50 g of glucose. RPE: rating of perceived exertion. Blood drop: assessment of lactate and recording of glucose. Vacutainer 2: venous sample for exercising epinephrine. Created with BioRender.
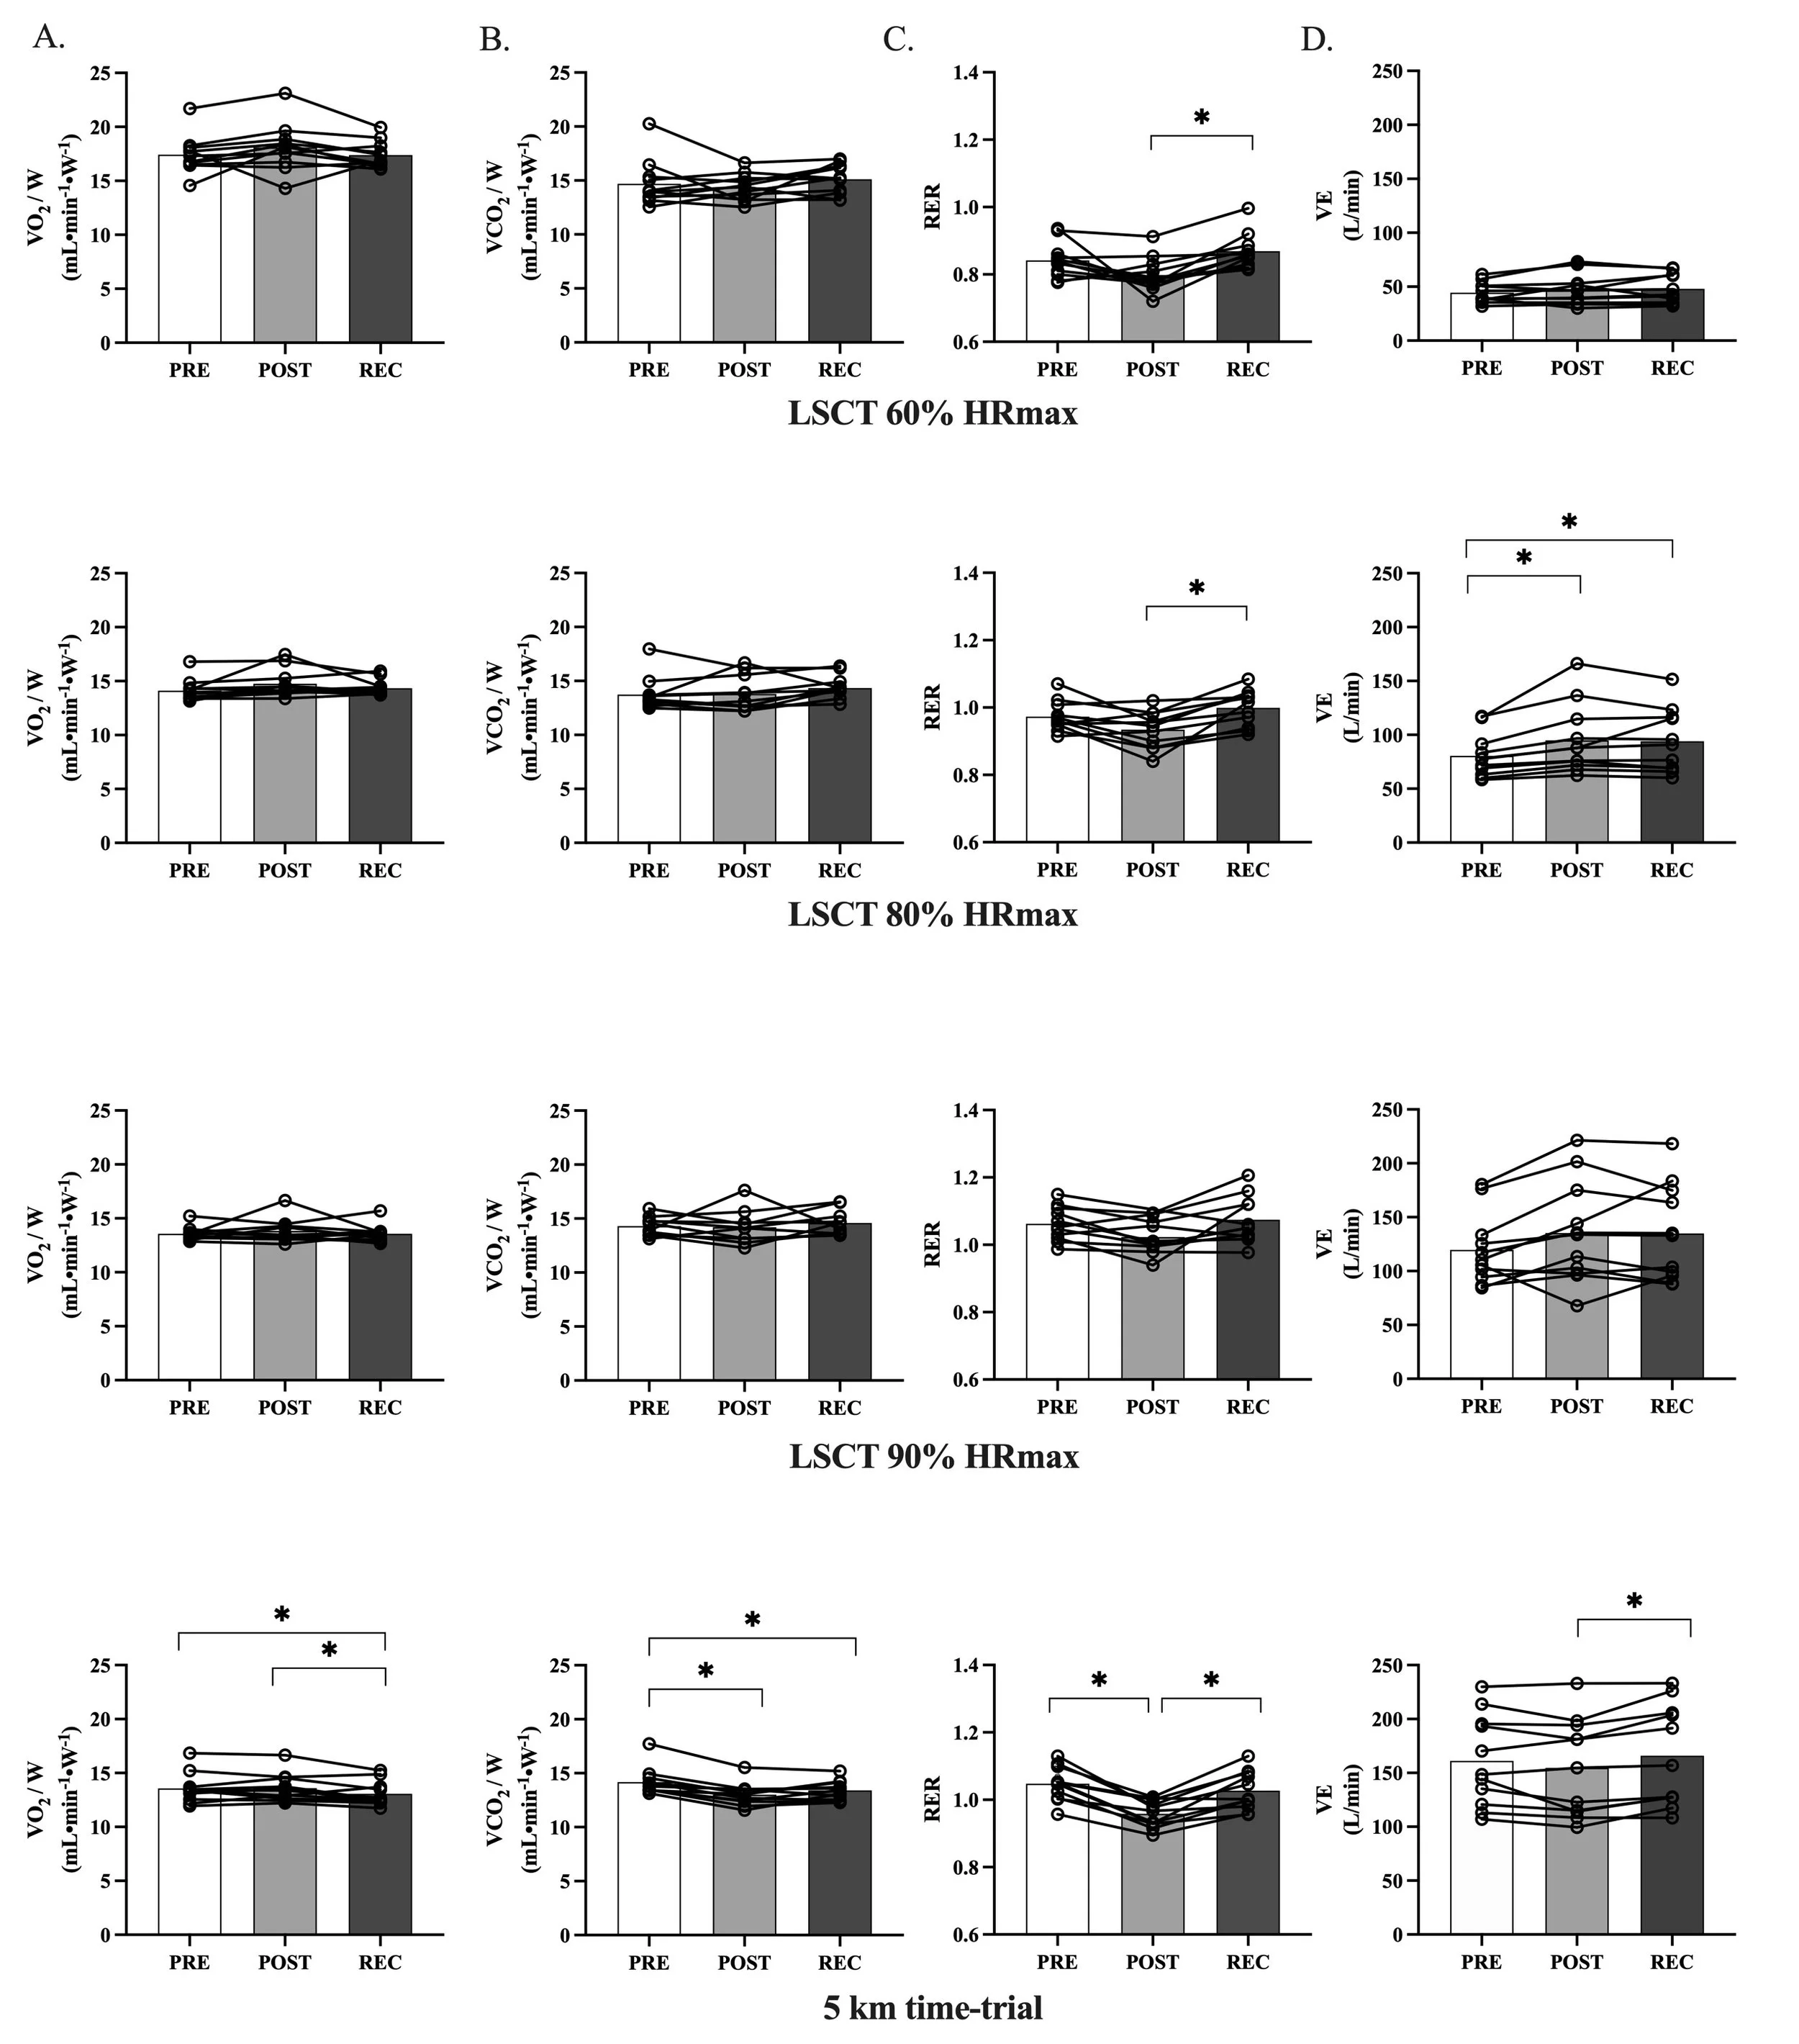
Figure 3. Alterations in mean oxygen consumption relative to cycling power (V̇O2/W; column A), carbon dioxide production relative to cycling power (V̇CO2/W; column B), respiratory exchange ratio (RER; column C), and ventilation (V̇E; column D) during the Lamberts and Lambert submaximal cycling test (LSCT) and 5km time-trial cycling before (PRE) and after (POST) 3 weeks of overload training, and following 1 week of recovery training (REC). Data as mean with individual values. *p<0.05, post-hoc comparisons with Bonferroni corrections.

Figure 4. CGM glucose concentration at each minute of the Lamberts and Lambert Submaximal Cycling Test (LSCT) (A) and 5km timetrial (C), and glucose area under the curve for the LSCT (B) and 5km time-trial (D) before (PRE) and after (POST) 3 weeks of overload training and following 1 week of recovery training (REC). Samples available for analysis, n=8 for the LSCT and n=9 for the 5km time-trial. Data as mean±SD or individual values.
Coates, A. M., Joyner, M. J., Little, J. P., Jones, A. M., Gibala, M. J. (2023). A perspective on high-intensity interval training for performance and health. Sports Medicine. Doi: 10.1007/s40279-023-01938-6
In this current opinion article we set out to define high intensity interval training (HIIT), and provide context for its use in improving performance in highly-trained endurance athletes, and improving health in insufficiently active populations. We suggest that exercise intensities can be determined using different metrics for performance or for health, but that both highly-trained athletes and insufficiently active populations can benefit greatly from HIIT.
A perspective on high-intensity interval training for performance and health
Figure 1. A conceptual framework for application of interval training in performance and health contexts. 1Authors’ example modeled after common frameworks including elements from Seiler [20]; Casado et al. [21]; and Jamnick et al. [23]. 2Common three-domain classification based on work rate or physiological indicators [22, 31, 32]. 3World Health Organization 2020 guidelines on physical activity [25]. 4American College of Sports Medicine’s guidelines for exercise testing and prescription, 11th ed. [26]. 5Anaerobic speed reserve [39]. 6Extreme-intensity domain [22, 35]. ASR anaerobic speed reserve, CP/CS critical power/critical speed, GET gas exchange threshold, HIIT high-intensity interval training, HRmax maximal heart rate, HRR heart rate reserve, LT1 first lactate threshold, LT2 second lactate threshold, MAS maximal aerobic speed, MET metabolic equivalent of task, MLSS maximal lactate steady state, MSS maximal sprint speed, RPE rating of perceived exertion (out of either 10 or 20 depending on the scale), SIT sprint interval training, VO2max maximal oxygen uptake

Investigating sensor location on the effectiveness of continuous glucose monitoring during exercise in a non-diabetic population
Coates, A. M., Cohen, J. N., & Burr, J. F. (2023). Investigating sensor location on the effectiveness of continuous glucose monitoring during exercise in a non-diabetic population. European Journal of Sports Science, 23(2):1-21. Doi: 10.1080/17461391.2023.2174452
In this study we investigated whether wearing a continuous glucose monitor (CGM) sensor on the leg would provide greater insight into glucose availability to the working muscle during cycling exercise than the traditional sensor placement on the arm. We found that wearing a CGM sensor on the arm was more accurate than the leg following glucose ingestion at rest. However, during cycling, wearing the CGM sensor on the leg provided greater insight into glucose delivery and uptake to the working muscle.

Figure 1. Interstitial fluid glucose sampled at the arm (triceps brachii) and at the leg (vastus medialis) following 100 g glucose bolus ingestion under resting (a), graded cycling (b), quadriceps electric muscle stimulation (c), and whole-body heating (d) conditions. Data as mean ± SD. Capillary sample data is for visual reference and is not included in the statistical analysis. *P < 0.05 between arm and leg sensor glucose recordings for isolated time points. Time 0 = pre-glucose ingestion.